
Overview
Purpose-built for India's largest de-addiction network.
The client operates India's largest chain of de-addiction and rehabilitation centres, spanning multiple states. Managing thousands of inpatient participants across geographically distributed centres using paper registers and disconnected spreadsheets had become operationally unsustainable.
Super Saphire was commissioned to replace that fragmented system with a single, role-aware platform that tracks every participant from admission through discharge — and across repeat visits — in real time.
Research & Discovery
What the data told us.
Prior to design, the team conducted interviews and site visits across multiple centres. The findings shaped every product decision — no assumption went untested.
Industry Context
The de-addiction landscape in India.
India's substance use disorder burden is significant. The Ministry of Social Justice & Empowerment's National Survey (2019) estimated ~57 million individuals affected by alcohol use disorders alone. Treatment penetration, however, remains critically low.
Treatment penetration gap.
"The gap between the scale of the problem and the reach of organised care is the single biggest opportunity for technology to make a meaningful difference."
— Sector insight from field research
What It Delivers
Six modules. One platform.
Every feature was scoped from research findings. Nothing was added speculatively — if a centre team didn't need it, it wasn't built.
Platform in Action
Built for the people who use it every day.
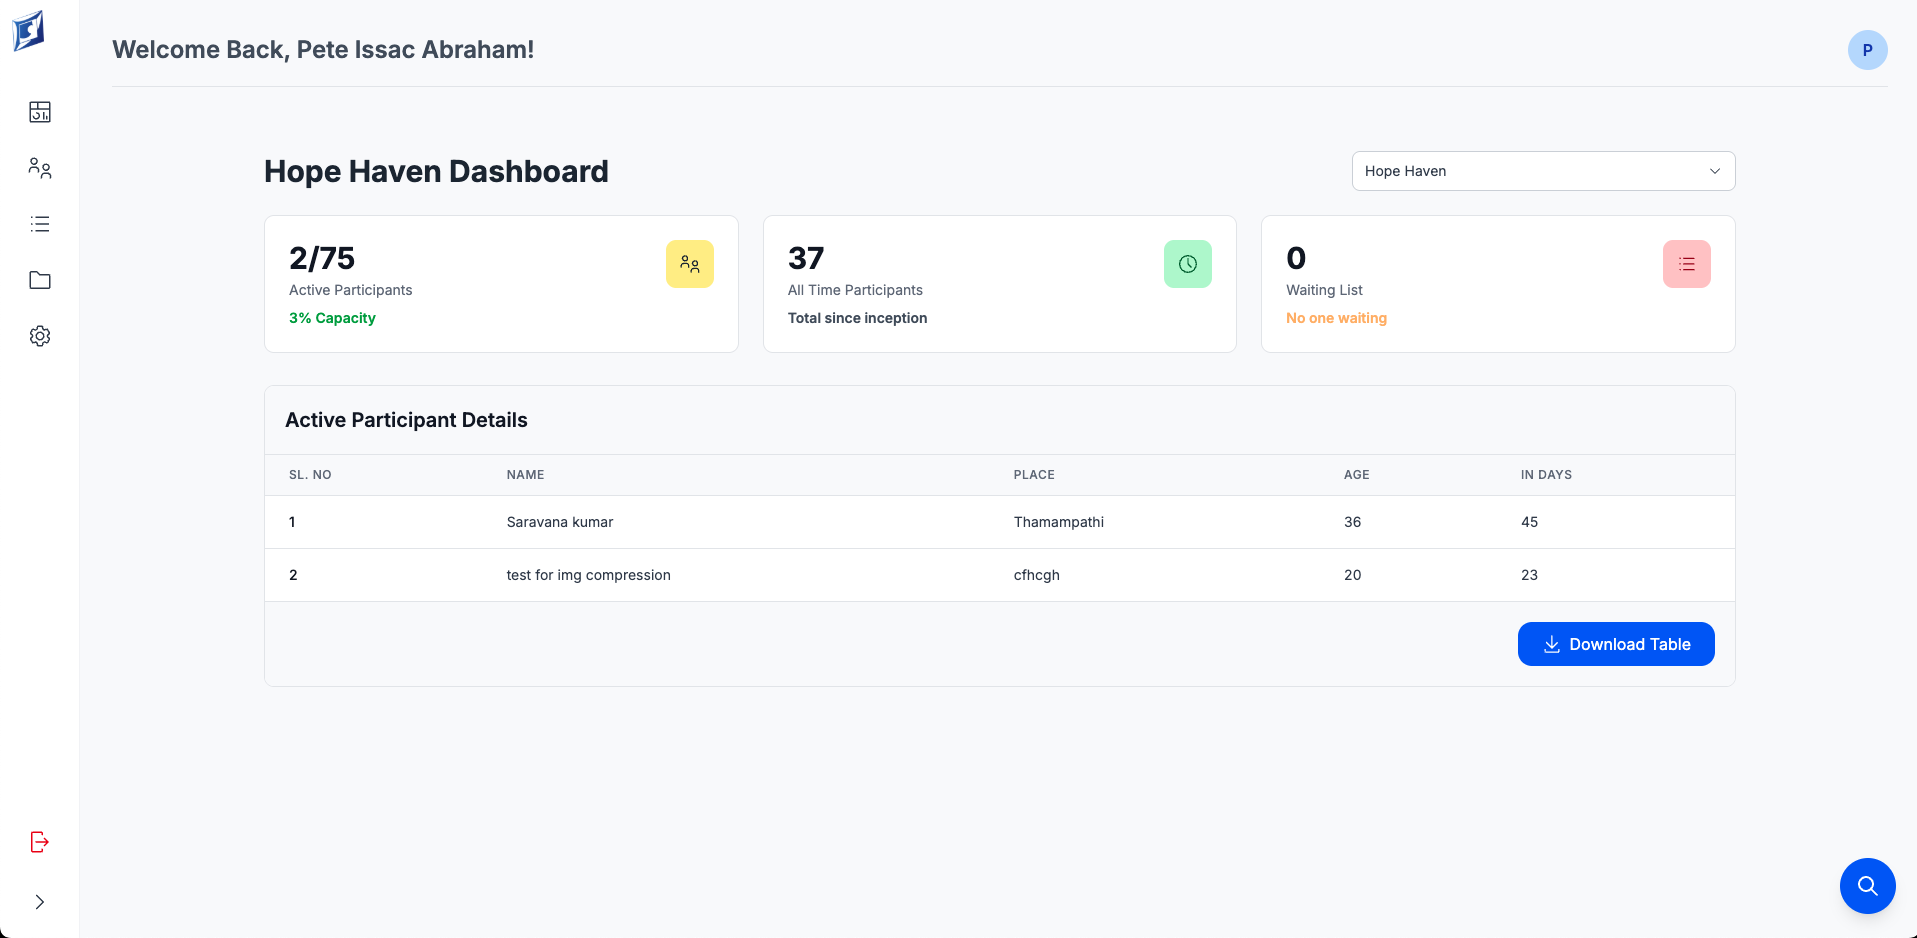
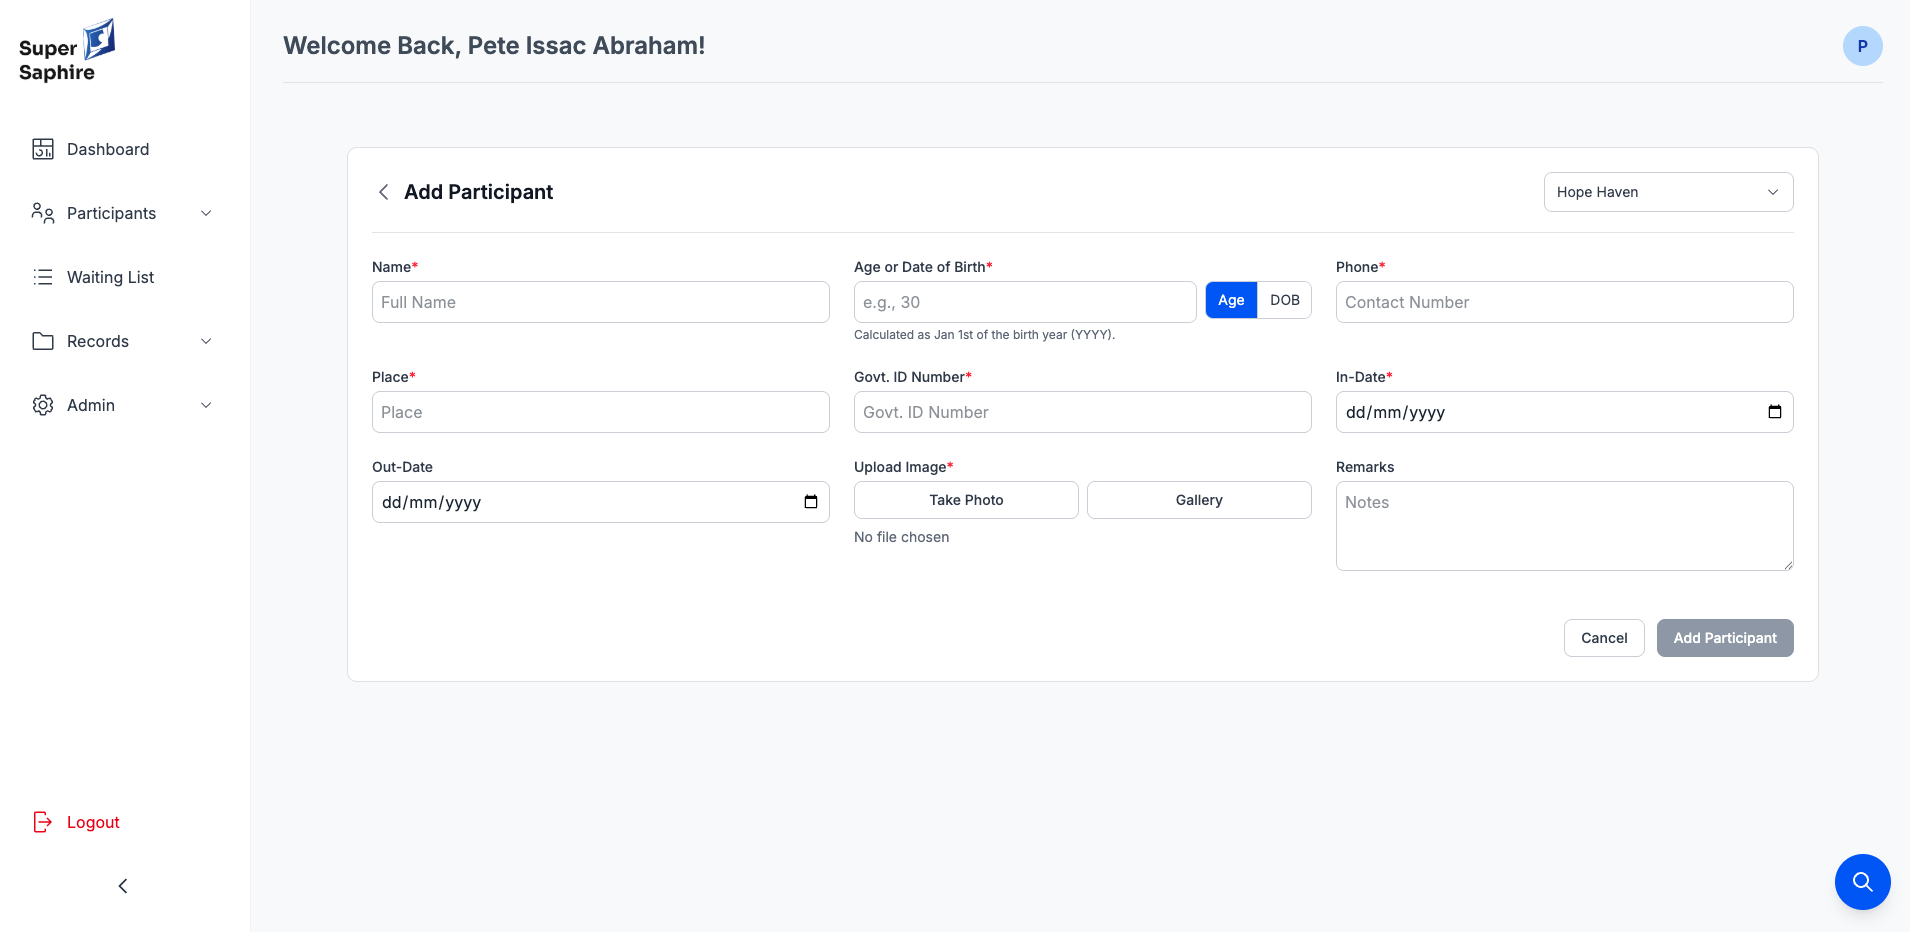
Every screen was designed around the real workflows of centre staff — from intake coordinators registering new participants, to senior management monitoring capacity across all 9 centres simultaneously.
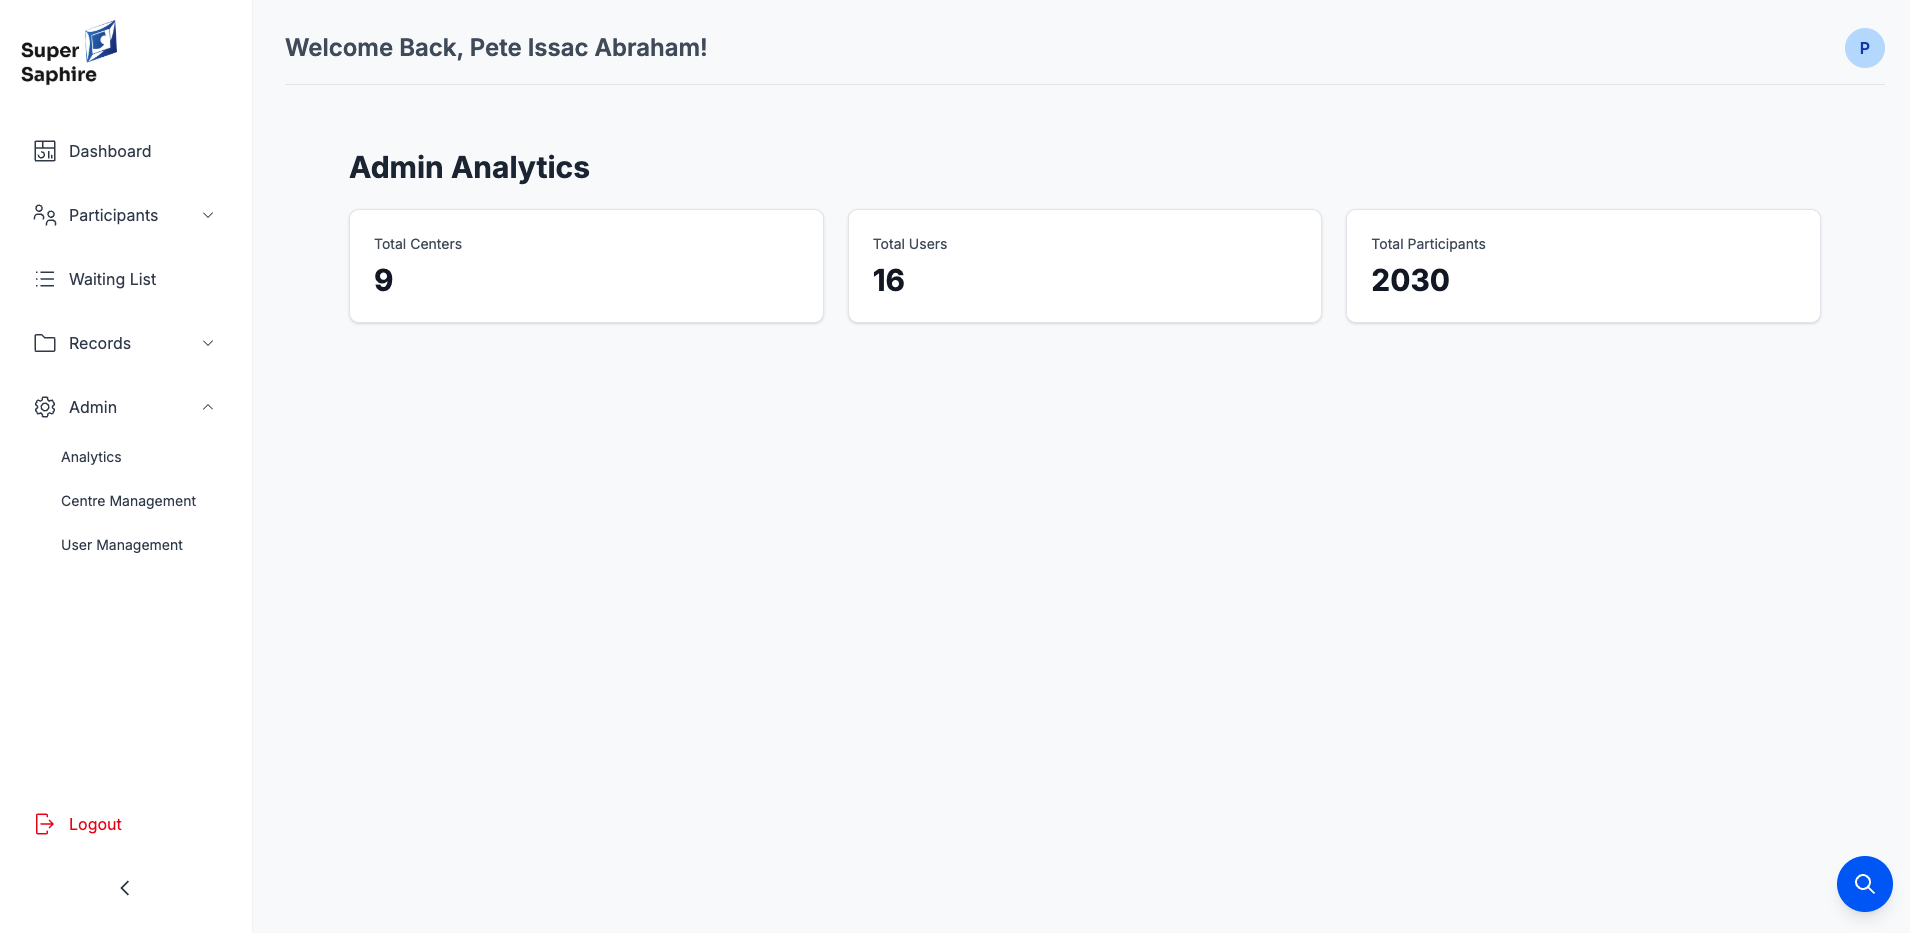
Admin Analytics gives network leadership a single-screen view of the entire operation: total centres, total staff users, and all-time participant count. The numbers that previously required phone calls across multiple centres now load in under a second.
The Centre Dashboard shows active participants vs. capacity in real time (2/75 = Active Participants / Total Capacity). All-time participant count, total since inception, and waiting list size update live — giving on-ground staff and remote managers the same picture at the same time.
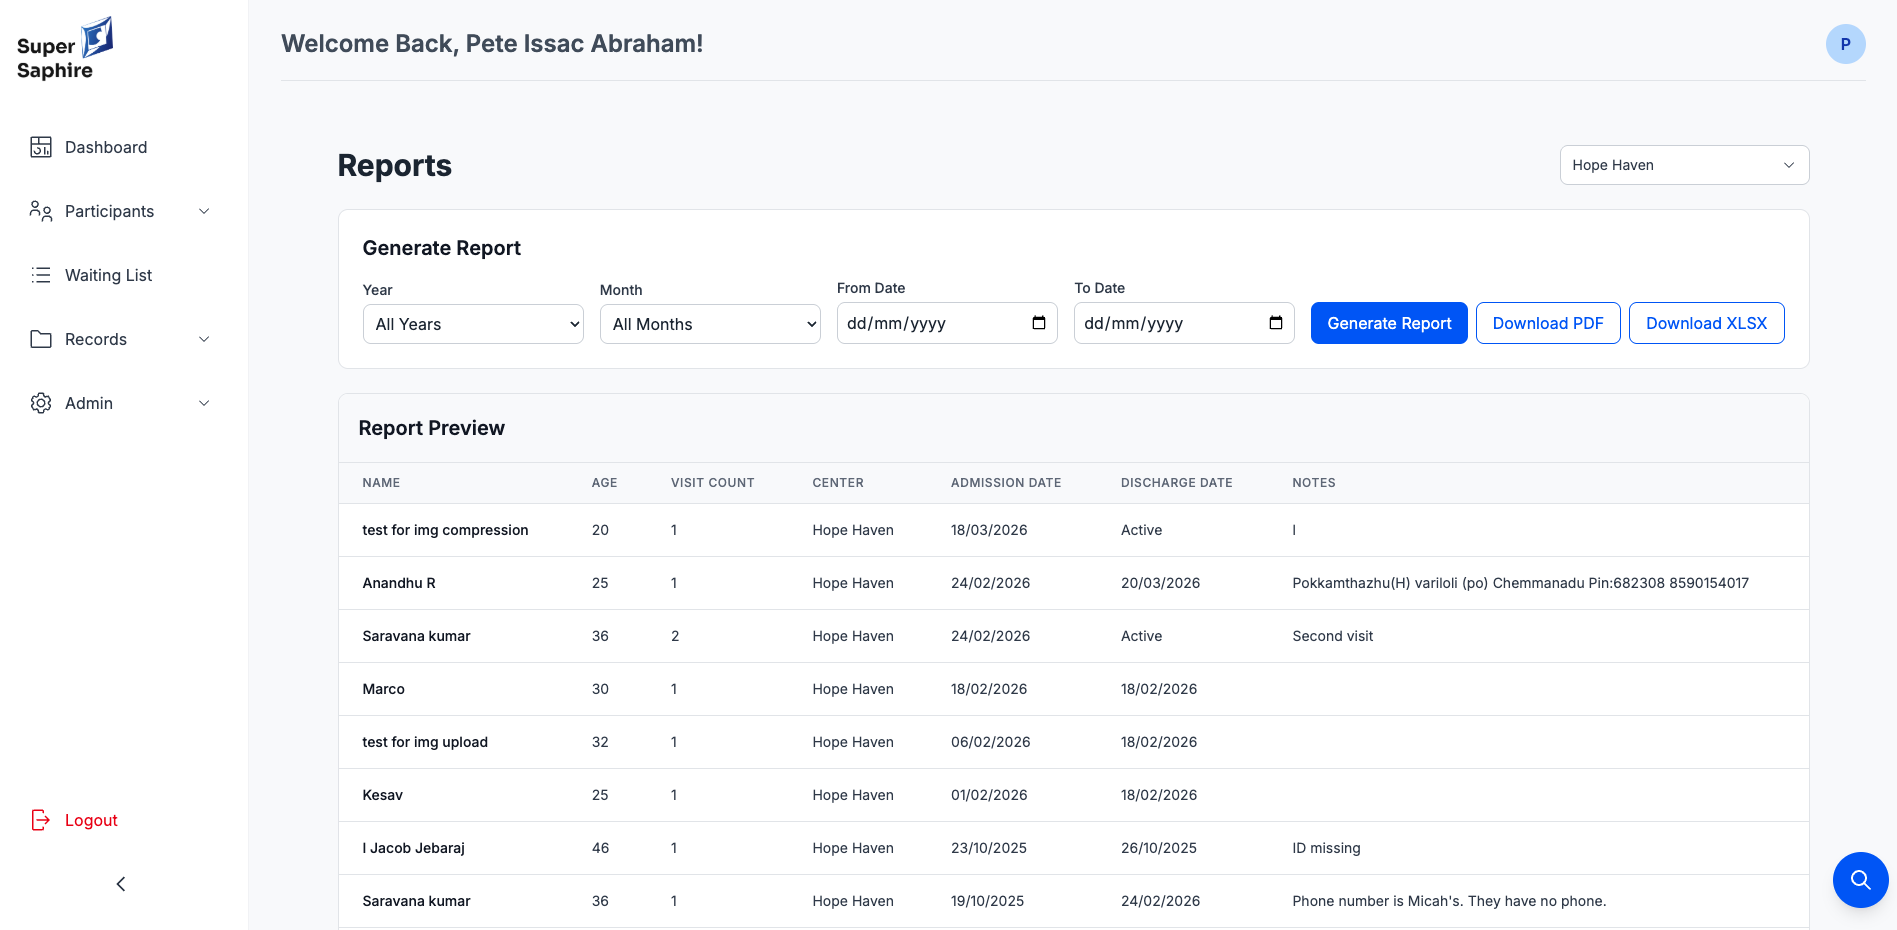
The Reports Module eliminates the 2–3 day manual compliance ordeal. Filter by year, month, or exact date range. Preview results inline before exporting. Generate a full compliance-ready PDF or XLSX in one click.
Rollout Timeline
From discovery to live across 9 centres.
Impact & Results
Live numbers. Real outcomes.
| Metric | Before | After |
|---|---|---|
| Report generation time | 2–3 days manual | Instant — one click |
| Cross-centre data visibility | Zero — phone calls only | Real-time dashboard |
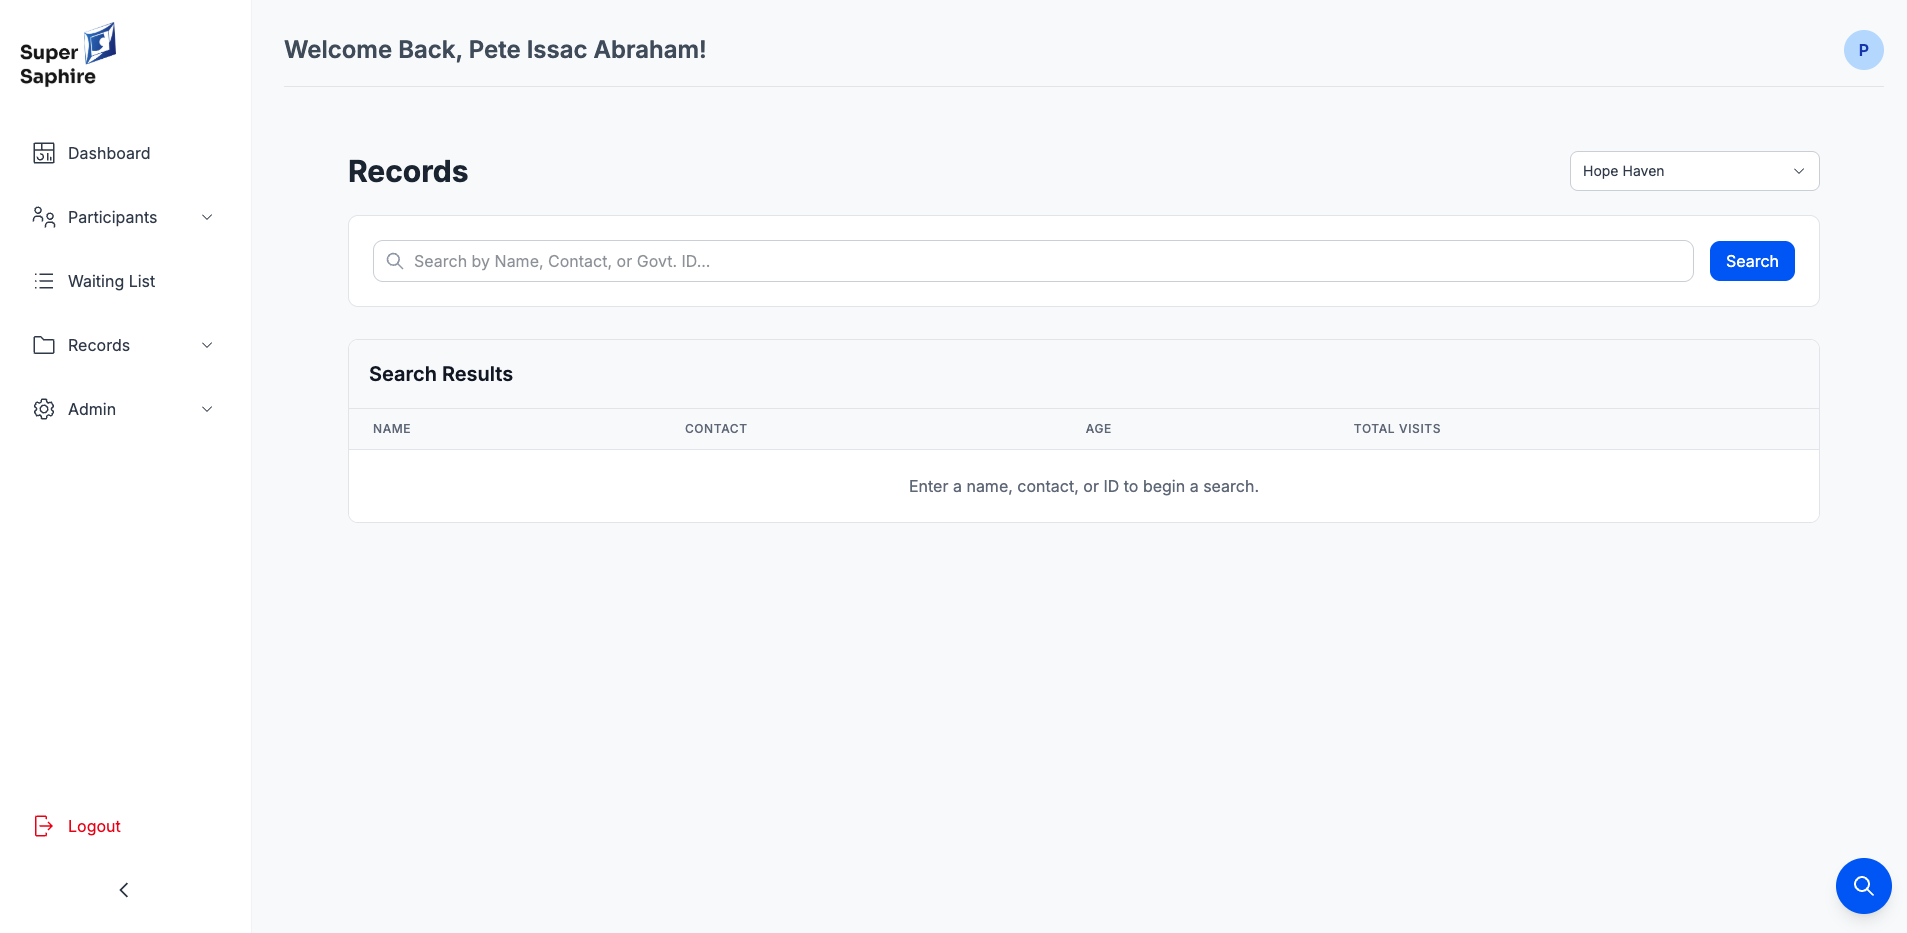
| Repeat-visit data retrieval | Not possible | Instant from any centre |
| Waiting list management | No formal queue | Tracked with follow-ups |
| Govt. ID capture compliance | Inconsistent | Mandatory at admission |
| Capacity planning | End-of-day phone rounds | Live bed occupancy view |
What's Ahead
The roadmap.
Super Saphire launched across all 9 centres and continues to evolve. The next phase focuses on deeper analytics and integration with national systems.
"What started as a records problem became a full operational platform. Super Saphire didn't just replace spreadsheets — it gave the organisation the operational clarity it had never had."
— Pete Issac Abraham, Lead Designer & Developer